Lighting design has evolved rapidly in the past two decades, and today’s architects, engineers, and product developers rely heavily on advanced tools to deliver efficient, safe, and visually pleasing environments. One of the most critical tools in modern illumination engineering is photometric curves in LED lighting. These curves provide precise data on how light is distributed, enabling the design of smarter, more energy-efficient solutions and ultimately a better user experience.
In this article, we’ll explore the definition, applications, and importance of photometric curves in LED lighting. By the end, you’ll understand why they are essential for manufacturers, lighting designers, and end-users who demand high performance from LED technologies.
What Are Photometric Curves in LED Lighting?
Photometric curves in LED lighting are graphical representations of how light is emitted and distributed from a luminaire. They illustrate the luminous intensity (in candela) at various angles, helping designers understand the beam spread, direction, and uniformity.
These curves are typically displayed in polar diagrams or Cartesian diagrams:
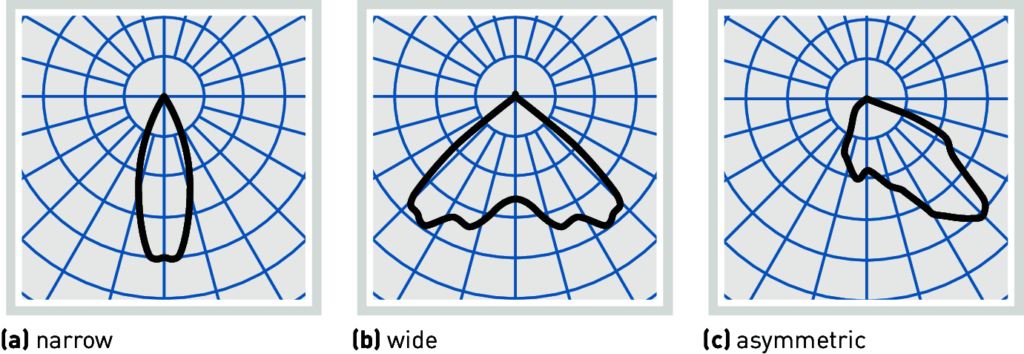
- Polar diagrams show the distribution of light intensity in a circular format, highlighting how light spreads at different angles.
- Cartesian diagrams plot light intensity against distance or angle, useful for understanding uniformity across a plane.
In simple terms, photometric curves serve as the “fingerprint” of a luminaire’s light output. Without them, selecting the right LED fixture for a specific application would be a matter of guesswork.
Why Photometric Curves Matter in LED Lighting
LED lighting has revolutionized the industry by providing energy efficiency, long lifespan, and design flexibility. However, LEDs behave differently depending on optics, reflectors, and housing designs. Photometric curves are essential because they:
- Ensure proper light distribution – making sure spaces are evenly lit without glare or dark spots.
- Help comply with safety and design standards – especially in workplaces, streets, and public infrastructure.
- Allow accurate lighting simulations – using software such as DIALux, Relux, or AGi32.
- Support energy efficiency goals – by matching the right luminaire to the environment, reducing wasted light.
Applications of Photometric Curves in LED Lighting
1. Street and Roadway Lighting
Public safety depends on reliable lighting. Photometric curves guide engineers in selecting LED fixtures that minimize glare, reduce light pollution, and deliver uniform brightness across roadways.
For example, asymmetric photometric distributions are often chosen for highways to prevent wasted light on non-road areas.
2. Architectural and Commercial Spaces
From museums to shopping malls, architectural lighting requires precision. Photometric curves help ensure:
- Accent lighting properly highlights artwork.
- Ambient lighting creates a comfortable environment.
- Task lighting supports productivity without eye strain.
3. Industrial and Warehouse Lighting
Factories and warehouses need high levels of uniform illumination for safety and efficiency. Photometric curves allow designers to avoid shadows in aisles, reduce over-lighting, and maximize fixture placement.
4. Sports Facilities and Stadiums
Sports lighting requires precise beam control to eliminate shadows and glare for both athletes and spectators. Photometric curves ensure that fixtures meet broadcast-level lighting standards.
5. Indoor Offices and Educational Institutions
Good lighting in offices and classrooms enhances focus and reduces fatigue. Photometric curves help balance lux levels, glare control, and uniformity.
6. Outdoor Public Spaces
Parks, plazas, and parking lots benefit from properly designed LED luminaires guided by photometric curves. This ensures safety and aesthetics while minimizing light spill into nearby residences.
Types of Photometric Distributions
Lighting professionals often refer to standardized IESNA (Illuminating Engineering Society of North America) photometric classifications:
- Type I: Narrow, elongated distribution – common for walkways.
- Type II: Wider distribution – used for side streets.
- Type III: Preferred for roadways and parking lots.
- Type IV: Forward-throw distribution – for building facades.
- Type V: Symmetrical distribution – for open areas like plazas.
These classifications rely heavily on photometric curves to determine the correct choice for an application.
The Role of Photometric Data in LED Product Selection
Manufacturers provide IES files or LDT files containing raw photometric data for their luminaires. Designers import these files into lighting simulation software to create realistic models of how light behaves in a given space.
Key parameters derived from photometric curves include:
- Beam angle – how wide or narrow the light spreads.
- Candela distribution – intensity of light in different directions.
- Lux levels – illuminance at a given surface.
- Uniformity ratio – consistency of light distribution.
Without photometric data, engineers would be forced to rely on trial-and-error, leading to poor efficiency and costly redesigns.
Importance of Photometric Curves in Energy Efficiency
One of the most compelling reasons to use photometric curves in LED lighting is their contribution to sustainability.
- They prevent over-lighting (wasted energy).
- They reduce light trespass into unwanted areas.
- They allow cities and businesses to meet energy codes and certifications (such as LEED).
For example, by analyzing photometric curves, a city planning department can reduce streetlight wattage while maintaining compliance with safety standards—saving both energy and costs.
How to Read a Photometric Curve
For beginners, reading photometric curves may seem daunting. Here’s a simplified guide:
- Locate the polar diagram – the circular graph showing light intensity.
- Check the angles – these show distribution directions (0°, 30°, 60°, etc.).
- Observe candela values – the further the line extends, the stronger the light in that direction.
- Interpret beam shape – narrow beams indicate spotlights, wide beams show floodlights.
Understanding these basics allows lighting professionals to make informed fixture selections.
Common Mistakes When Ignoring Photometric Curves
- Uneven illumination – hotspots and dark zones.
- Excessive glare – causing discomfort and hazards.
- Non-compliance with standards – risking legal and safety issues.
- Higher operational costs – due to wasted energy.
This highlights why photometric analysis is not optional—it’s a necessity.
Future Trends in Photometric Curve Applications
With advances in LED and smart lighting, photometric curves will become even more important:
- Dynamic lighting systems – tunable white and RGB fixtures require multiple photometric datasets.
- AI-driven lighting design – software can auto-adjust layouts based on photometric predictions.
- Integration with IoT – photometric data helps optimize adaptive streetlighting that dims during low traffic.
Conclusion
Photometric curves in LED lighting are more than technical graphs—they are the blueprint for effective, efficient, and sustainable lighting design. Whether applied in streets, offices, stadiums, or homes, they ensure the right balance of brightness, safety, and comfort.
As lighting technology continues to evolve, mastering the use of photometric curves will remain a vital skill for engineers, architects, and facility managers. By leveraging these tools, we not only save energy but also create better visual experiences for all.
ES Lighting Handbook – Industry standards for photometric data.